The rainshower notes so far have been about the parts that refuse things: the solver that will not take two observers standing together, the field screen that never says meteorite, the sky screen that never says anything but "nothing located in the atmosphere." This one is about the part that was missing, and about what changed when it stopped being missing.
The rule, and what it was waiting for
Since the globe was first drawn, the repository has carried a rule in capitals: there is no land elevation and none may be invented. The reason was practical and then it was principled. No real global elevation grid could be reached from the machine the app was built on, and a generated relief surface looks exactly like a measured one. The sea floor was allowed because published depth contours were reachable; the land stayed flat and the legend said so.
This week a real one was reachable. The Terrain Tiles set on the AWS Open Data programme serves elevation as image tiles, in an encoding its publisher wrote down, and every tile comes back with a header naming the dataset it was cut from. At the zoom the global grid was built from, all 1,024 tiles name the same thing: NOAA's ETOPO1 bedrock grid. The build script refuses to run if they do not, because the metadata claims a single source and a claim like that is enforced rather than assumed.
A grid that has been transposed, flipped, or decoded with the channels in the wrong order still looks like terrain, because everything looks like terrain. So the finished image is checked against data made by other people. Natural Earth's coastline, sampled through it, sits at a median of 37 metres. Natural Earth's depth contours, from 2,000 metres down, land within 3 percent of their stated depths. The ocean fraction and mean depth match the published figures. Published spot heights hold. Those checks run again in the test suite, so a corrupted or regenerated image fails the build instead of shipping.
Two things are absent on purpose. The tiles stop at 85 degrees, so the polar caps have no data and are drawn flat with a note. And the relief is at true scale by default; there is an exaggeration slider, and whenever it is not at one the legend says so, and says that the trajectory and its altitudes are never exaggerated, so a raised mountain can stand above a real path that in fact cleared it.
The check that needed it
Nothing in the solver had ever asked whether a reported sightline was open sky. A station reports a start azimuth and elevation, and if the observer says the fireball started two degrees above the horizon toward a ridge that stands at six, the line begins inside the hill. The observer may have misread a frame, a compass or an angle, but the observation as written cannot have happened, and that is worth knowing before anybody drives anywhere.
So there is now a ground view. It stands the camera at an observer's feet, 1.7 metres up, on the real ground, at true scale, and draws the trajectory, the search area, the other station and the sightlines that station reported, from there. Close to the station the browser fetches finer tiles, a few hundred metres a cell, and the panel names the datasets the tiles came from, read from their headers.
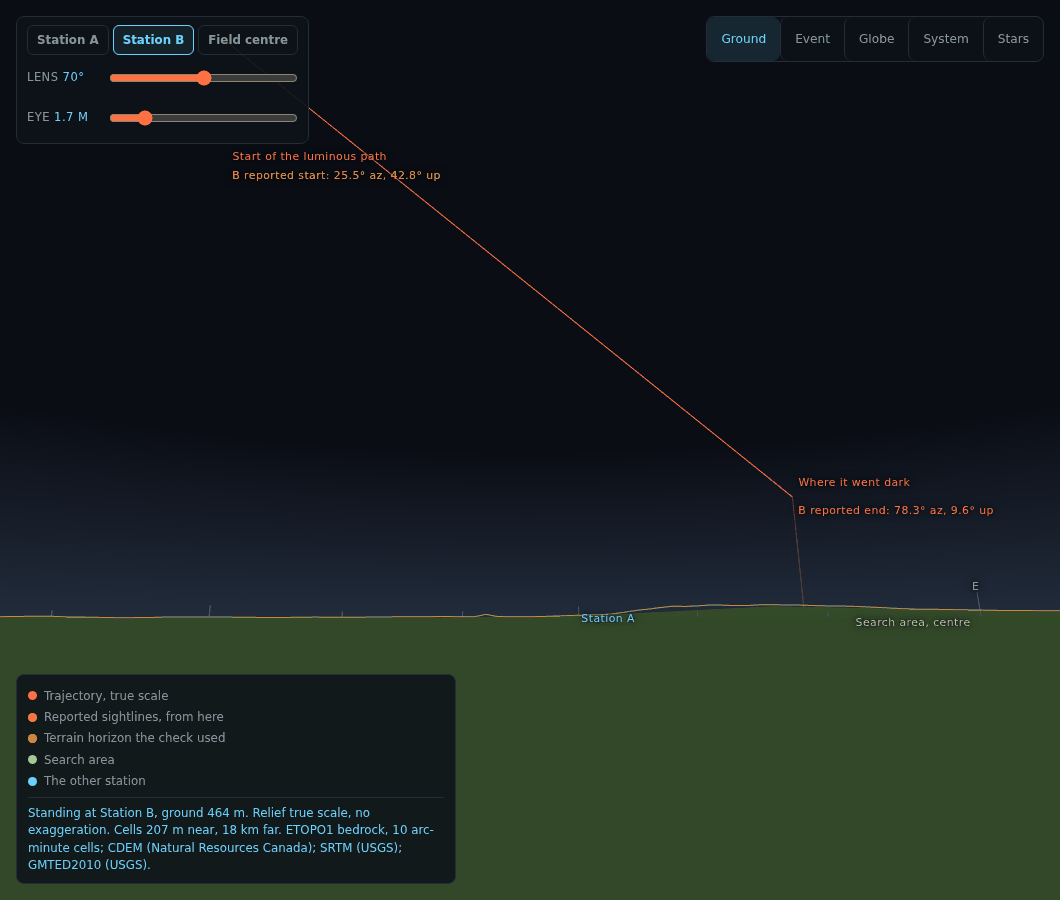
The check itself walks the terrain horizon all the way round the station, with the Earth's curvature and standard refraction, and asks whether each reported angle is above it. The verdict is blocked, unresolved or clear, and clear rules out nothing. It says so in as many words. The only positive finding is blocked, and blocked is issued only when the reported angle is below the horizon by more than the elevation data could plausibly be wrong by: the band of doubt is the angle one data cell subtends at the distance of the ridge, so 18 kilometre cells refuse very little and 200 metre cells refuse more. The terrain horizon the check used is drawn over the ground as a thin line, and it should hug the silhouette. Where it does not, one of them is wrong.
The planets, as they are
The system view used to draw the planets as coloured dots, held at a constant size on screen because at any zoom where Jupiter's orbit fits, a true-scale Earth is a ten-thousandth of a pixel. The sizes are still symbols. The surfaces are not.
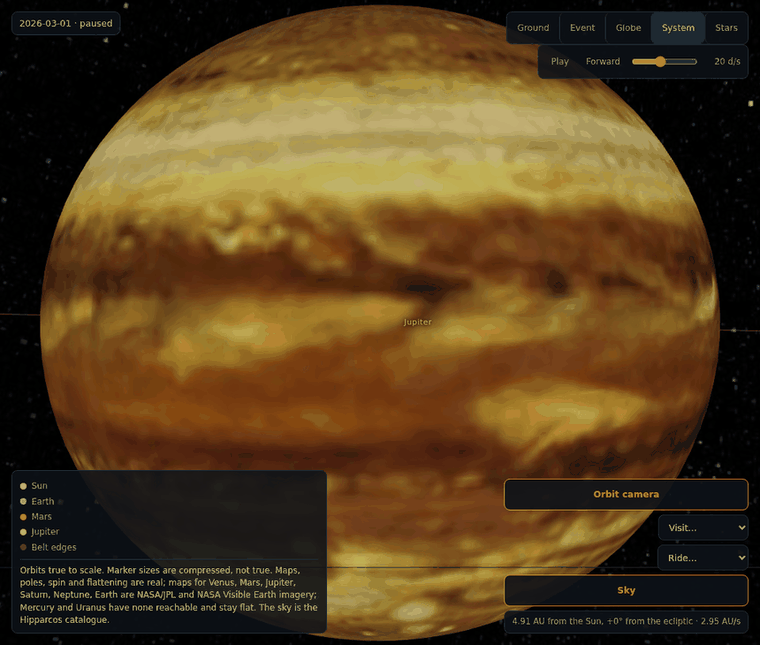
Venus, Mars, Jupiter, Saturn and Neptune wear the maps in NASA's own 3D Resources collection, which its README says are free and without copyright. Earth wears NASA's Blue Marble with clouds over it and city lights on the night side. Each map's file, source and commit is written into a metadata file, and the legend reads its sentence from that file rather than from a constant. Mercury and Uranus have no map in either source and are drawn as the flat markers they were. I did not invent them.
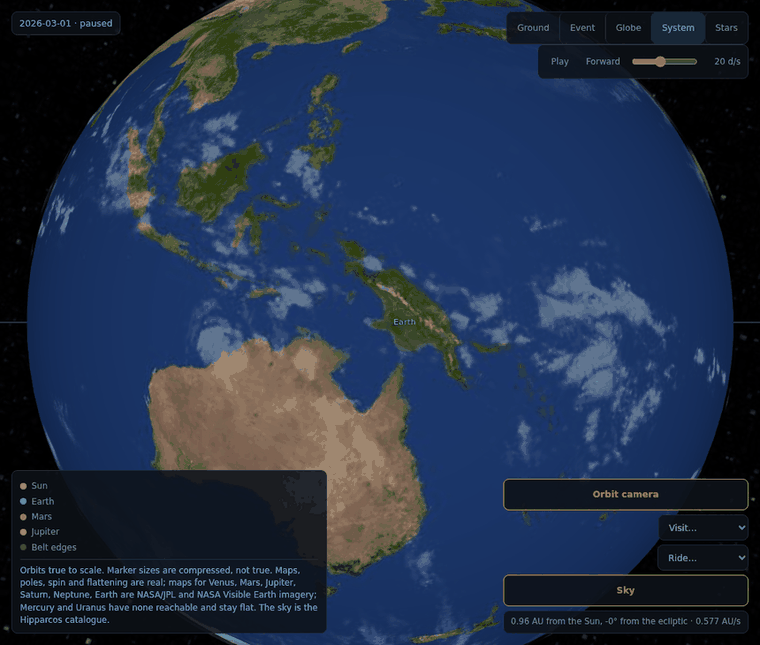
Each globe is lit from the Sun, so the phase is real. Each is squashed by its real flattening, tilted to its pole, and turned to its prime meridian for the instant on the clock. Saturn's rings sit at their published radii with opacity set by optical depth, and they are nearly edge-on right now because that is where 2026 puts them. Behind everything is the Hipparcos catalogue as a sky. An all-sky image can be printed with right ascension increasing either way and zero at the edge or the centre, and all four look like a sky, so the build looks up the ten brightest stars by catalogue position under each reading and keeps the one that finds them. It found eight of ten under one reading and none under the others.
Two of the numbers in that table were wrong from memory and the test caught both, which is the part I want to record. The pole directions come from one source and the rotation periods from another, remembered separately, and the test requires them to agree: the rotation rate must give the published day, and the pole rotated into the ecliptic must give the published tilt. Neptune's rate was off by a percent and failed the first. Venus and Uranus failed the second until I understood why: the IAU north pole is not the spin axis. It is the pole on the north side of the invariable plane whatever way the body turns, so those two point up and spin backwards, and the published tilt is measured from the other convention. The test now folds that in explicitly rather than widening a tolerance until it passes.
A body you can build
The sandbox already flew a body described by four numbers: mass, bulk density, strength and ablation coefficient. Nobody thinks about a rock that way. There is now a builder: a shape, a longest axis, a mix of iron-nickel, silicate, carbonaceous matrix and ice by volume, and a porosity.
Volume, mass and bulk density come out of that as definitions. Strength and ablation do not, and the panel says so beside each: they are mixing rules, a volume-weighted mean for one and a geometric mean reduced by porosity for the other, and a real rock's strength is set by the weakest connected path and by cracks nobody can see from outside. The presets are recovered meteorite classes with published bulk densities, and the density the mix produces is shown next to the published one with the difference. The mix was not tuned until the numbers matched; the difference is printed.
Built, the body can go into the flight, or onto an orbit from perihelion, aphelion and three angles, where it joins the tracked list marked as invented and can be flown to and ridden.
Cockpits
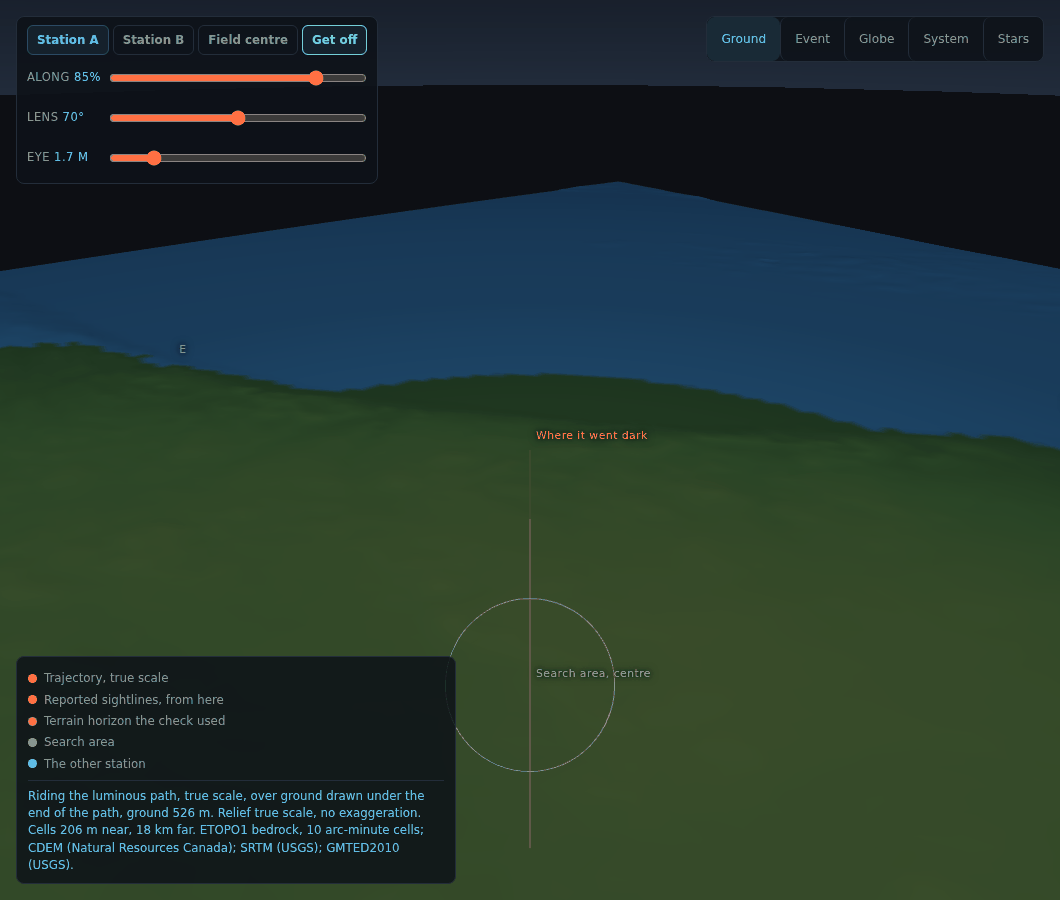
Riding is what it sounds like. Pick a planet or a tracked body and the camera sits on it, facing the way it is going, with a drag to look around and the body's real orbital speed in the corner, which is the one camera readout in that scene that is a physical claim. In the ground view there is a seat on the luminous path, at true scale, with a slider for how far along, over the real ground under where it went dark.
And it works on a phone now
It did not, really. Measured on an emulated phone, the system view's camera controls, play bar, clock and legend covered 84 percent of a stage that is only half a screen tall, and the clock sat on top of the view picker. The globe could not zoom at all, because it only listened to a mouse wheel. The panel was thirteen thousand pixels long.
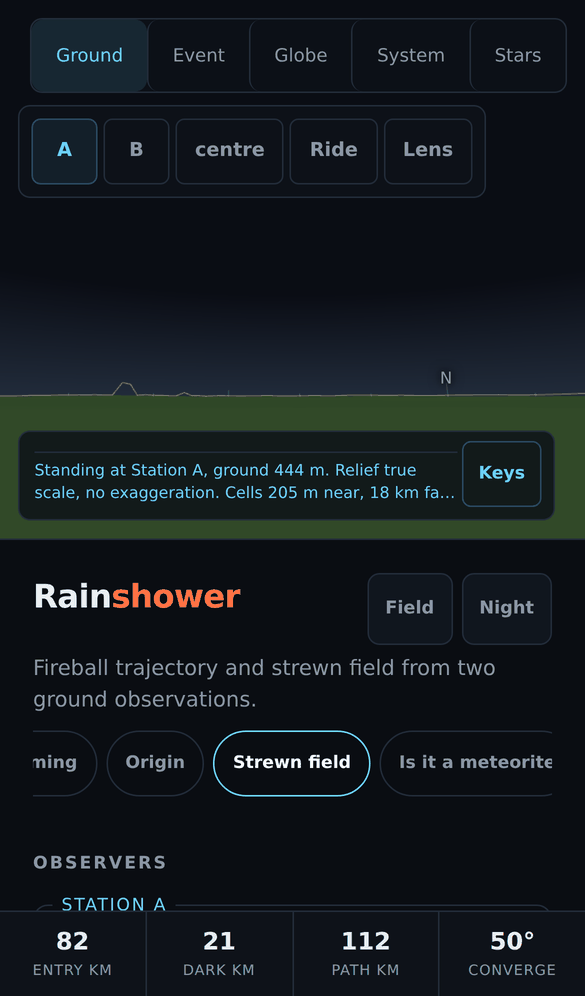
Every overlay now folds to a button until tapped. The legend shows two lines and opens on a tap. Two fingers zoom the globe and change the lens in the ground view. A row of the sections actually on screen sits under the masthead and jumps to any of them. Phones fetch a half-size elevation image and draw a quarter of the vertices. The measurement that found the problems runs every overlay in every scene and requires no overlap and nothing under 44 pixels, and it passes.
This is the same shape as everything else on this blog. The layout looked fine on the screen it was built on. Nothing said otherwise until something measured it.