Most of what a car can do comes out of one number: how hard its tyres can push on the road. Braking spends it, turning spends it, and a slide spends it sideways. Here are seven questions about cars, each made as a 15.5-second reel and each answered by our own engine, powered by rainshower. Every answer is also checked a second way: a closed form against the same thing stepped in time, or a solver against a driver in the loop.
One thing to be plain about first. The grip curve is Pacejka's magic formula, the standard fit for how a tyre's grip changes as it slips, and its coefficients for dry and wet asphalt and for snow are the ones commonly quoted, typed from memory rather than checked against a source. Every distance below rests on them.
Why anti-lock brakes stop you shorter
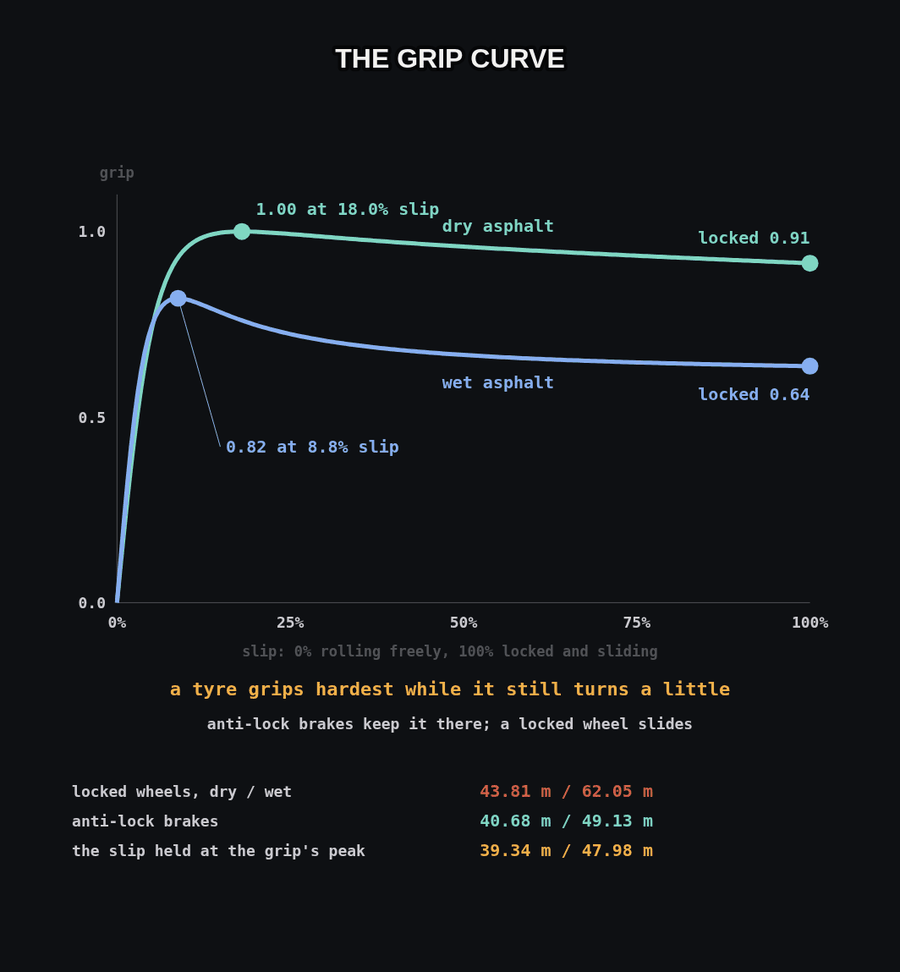
A tyre grips hardest while it is still turning a little. Braking on dry asphalt, the grip peaks at 1.00, a braking force equal to the weight on the tyre, with the tread slipping 18% against the road. Lock the wheel and it slides at 0.915. On wet asphalt the peak is 0.82 at 8.8% slip, and a locked wheel slides at 0.637.
So a locked wheel is not the hardest braking there is, though it feels like it. That is a well formed answer that happens to be false, and the feel of the pedal gives it. The car is modelled as one wheel carrying a quarter of a 1,500 kg car, braked from 100 km/h as hard as it will go. Locked wheels stop in 43.81 m on a dry road, sliding for 95.1% of the stop (the rest is the moment the brake takes to lock them). Anti-lock brakes let the brake off whenever the slip rises past a narrow band round the peak, and put it back on below it; they stop in 40.68 m without ever locking. On a wet road it is 62.05 m against 49.13. Anti-lock saves 3.1 m dry and 12.9 m wet, because wet grip falls further below its peak once the wheel locks.
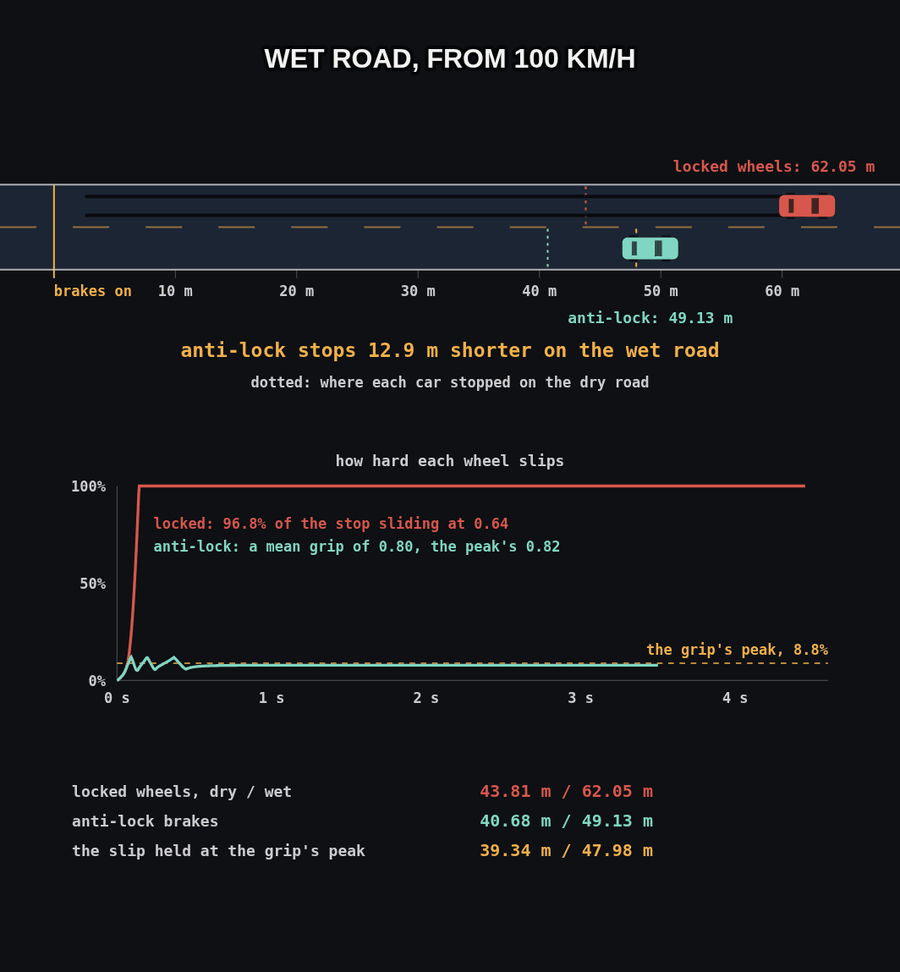
The second route holds the slip exactly at the grip's peak, which is the best any brake could do. The wheel stepped in time then stops where v² / 2μg says, 39.34 m dry and 47.98 m wet, within 6 millionths of a metre. Anti-lock comes within 1.34 m of that dry and 1.15 m wet.
Why a corner takes longer to stop in
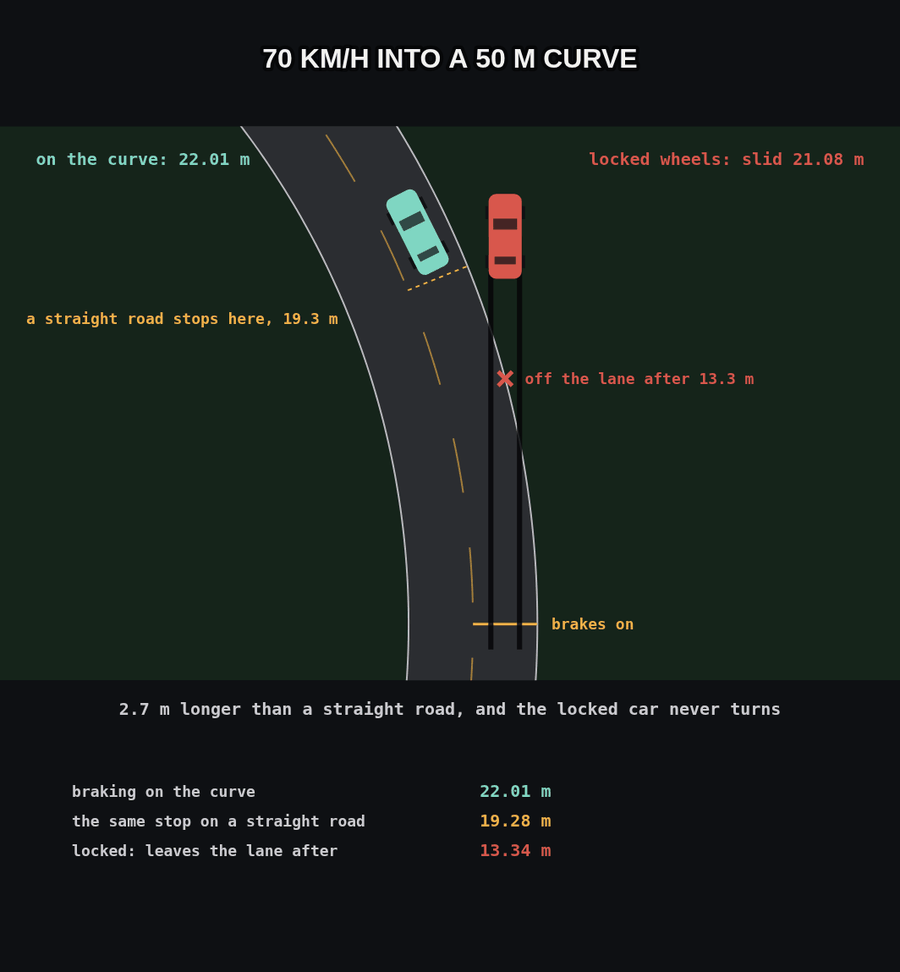
The grip budget points every way at once, so whatever turning takes, braking cannot have. Into a 50 m curve at 70 km/h on a dry road, holding the curve takes 77% of the grip at first. As the car slows, turning needs less and the brakes get the rest, and the car stops in 22.01 m, against 19.28 m on a straight road. At the curve's limit, 79.7 km/h, the stop stretches to a quarter of the circle: 39.3 m, against 25.0 m straight.
Lock the wheels in the corner and there is nothing left to turn with. The car slides straight on for 21.08 m and leaves a 3.5 m lane after 13.34 m.
The stop on the curve has a closed form, (R / 2) asin(v² / μgR). The second route flies the car as a point in two dimensions, step by step, with friction pulling toward the centre by exactly what holds the curve and backward by the rest. It stops where the formula says, within 5 hundred-millionths of a metre at every speed into the curve.
Ten kilometres an hour
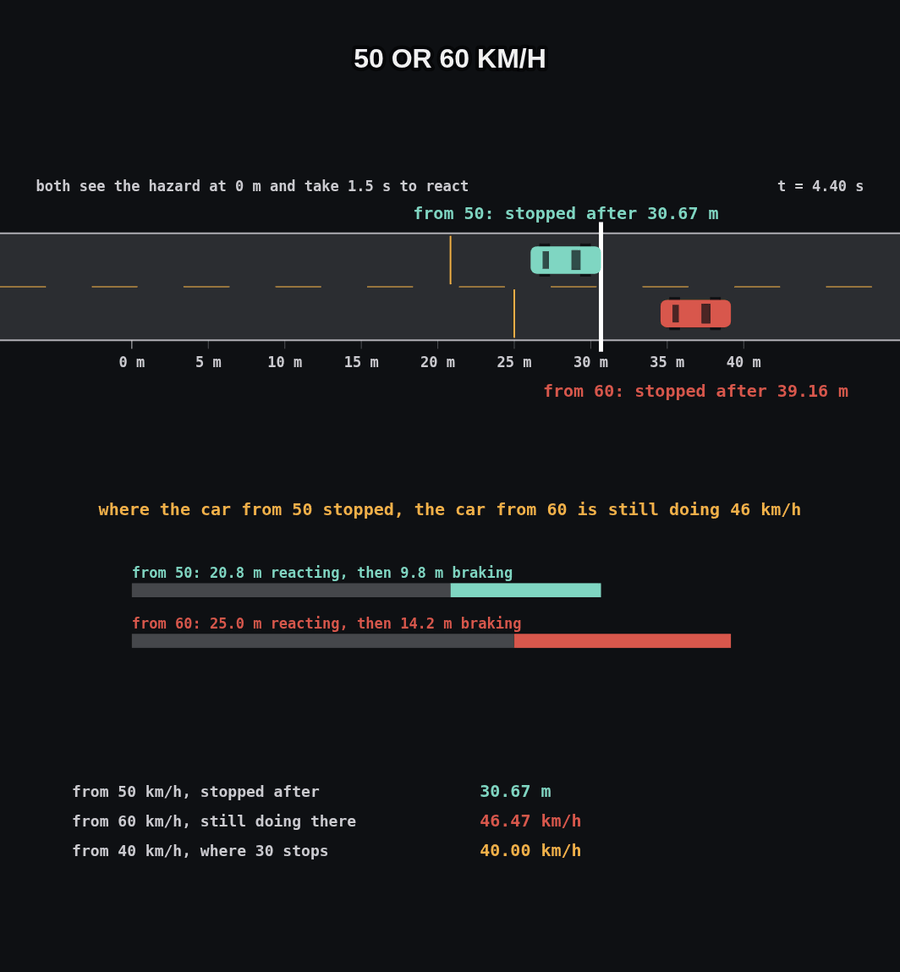
Before a car brakes at all, its driver has to see the hazard and move a foot. Give that 1.5 seconds, a round figure chosen here and not a measurement, and then brake as hard as a dry road allows. From 50 km/h a car covers 20.83 m reacting and 9.84 m braking, and stops 30.67 m from where the hazard appeared. A car from 60 km/h is still doing 46.47 km/h at that spot. From 70 km/h it is doing 67.22.
The reacting distance grows with the speed and the braking distance with its square. So ten more kilometres an hour at the start is forty-six at the place where the slower car stopped. At the low end, a car from 30 km/h stops after 16.04 m, while a car from 40 km/h has covered 16.67 m before its brakes even go on.
The stops stepped in time land where the closed form puts them. Swapping the perfect brake for anti-lock moves the 60 km/h car's speed at that spot by 0.24 km/h.
Two seconds behind
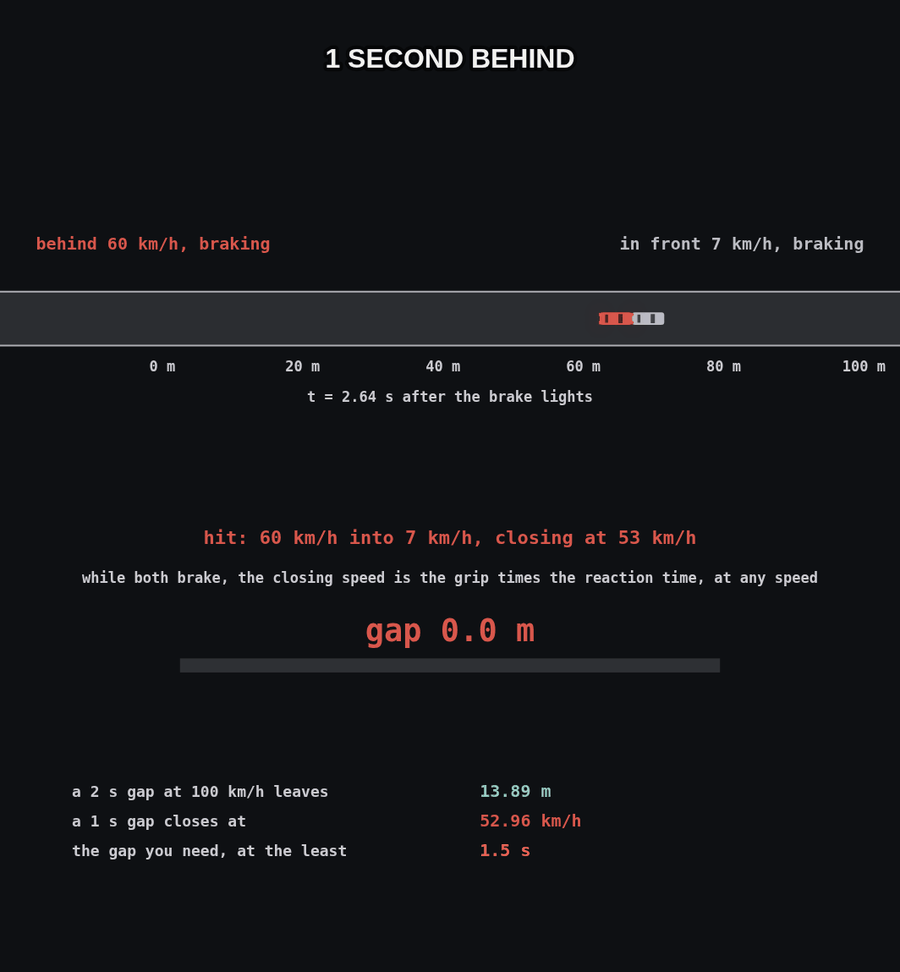
The same reaction time is the reason for the two-second rule. Two cars are doing 100 km/h. The one in front brakes as hard as it can, and the one behind reacts for 1.5 s and then does the same. With a 2 s gap they end up 13.89 m apart once both have stopped, and with a 3 s gap 41.67 m. A 1 s gap ends in a hit 2.64 s after the brake lights, with the car behind still doing 59.81 km/h and the one in front 6.85 km/h.
While both cars brake, the gap closes at the grip times the reaction time: 1.00 × 9.81 m/s² × 1.5 s, or 52.96 km/h, at any starting speed. The car behind started braking 1.5 s late and never makes it up, so any gap shorter than the reaction time ends in a hit. From 50 km/h, a 1 s gap meets the car in front after it has already stopped, at 42.01 km/h. Stepped in time, the two cars meet when and as fast as the closed form says, within 1.4e-9 in seconds, km/h and metres.
Inside the headlights
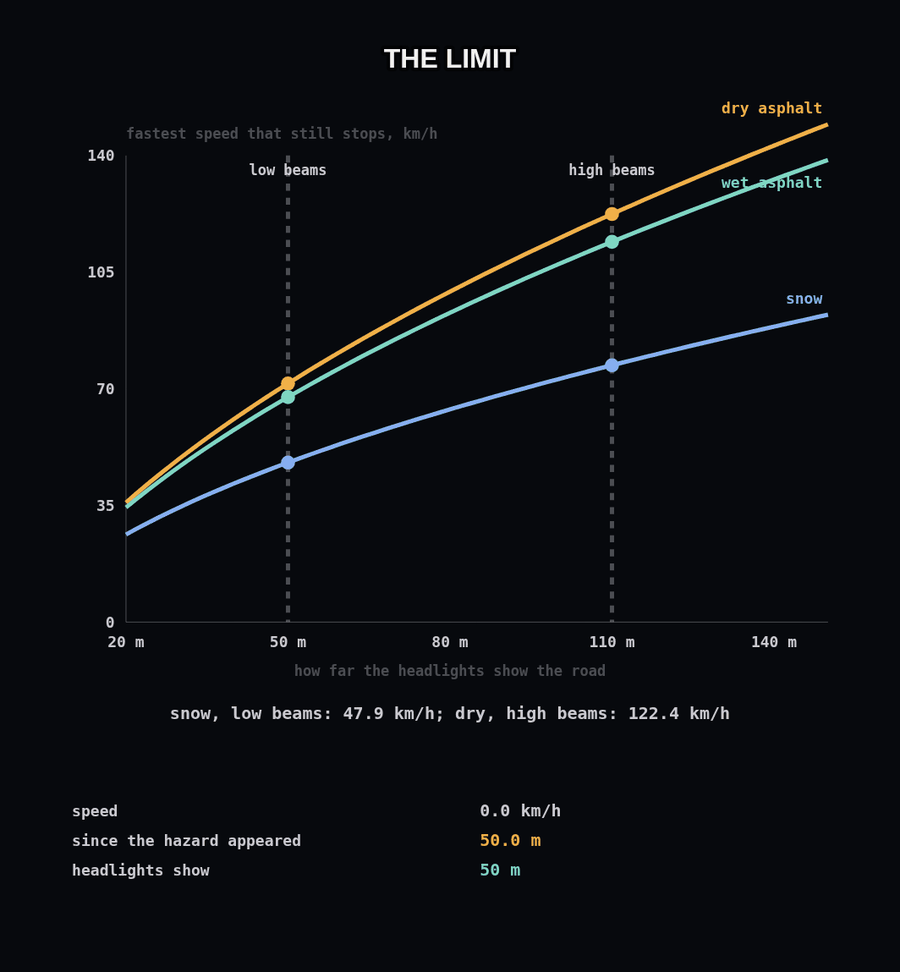
At night a hazard appears where the headlights reach. With 50 m of road lit on low beams (a figure typed from memory) and the same 1.5 s to react, the fastest a car can go and still stop at the hazard is 71.6 km/h on dry asphalt, 67.5 wet and 47.9 on snow. With high beams lighting 110 m it is 122.4, 114.1 and 77.1. From 90 km/h on low beams, a car covers 37.5 m reacting and reaches the hazard still doing 70.2 km/h.
That speed is the root of a quadratic, v t + v² / 2μg equal to the range. A bisection on the stopping run, stepped in time, finds the same speed within 7.2 millionths of a km/h.
Sideways on purpose
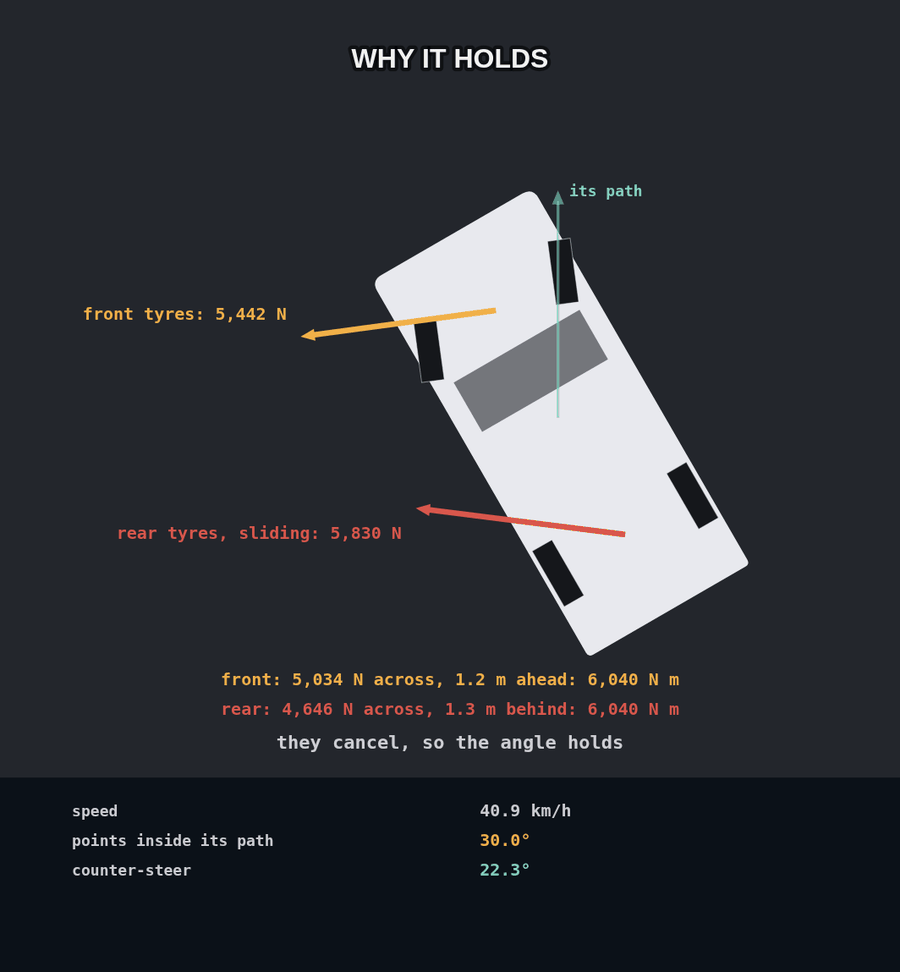
A drifting car points one way and goes another. Here it is a 1,300 kg car modelled as a bicycle, its two wheels on one line, its tyres gripping the same in every direction and no weight moving between them. It points 30 degrees inside its path round a 15 m circle. Newton's method finds the balance: 40.88 km/h with 22.33 degrees of counter-steer, the rear wheels spinning as if the car were doing 53.58 km/h. The rear tyres slide at 95.3% of their peak grip and the front at 82.1%. Their turning moments about the car's middle cancel at 6,040 N m each.
The second route is a driver who knows nothing of Newton's method and steers only to hold 30 degrees on the 15 m circle. Started 5 degrees short at 11 m/s, after 30 s the car settles within 7.6e-11 of the same speed and steering.
The drift cannot be held with the hands still. With the steering and throttle frozen, any disturbance grows by a factor of e every 0.34 s, an eigenvalue of 2.95 per second that the car stepped in time matches to 1.3e-4. Nudged 1 degree further round, the car points more than 90 degrees off its path after 2.08 s; nudged 1 degree less, after 2.51 s. Gripping instead, the same car could go round the same circle at up to 42.88 km/h, 2.00 km/h faster than the drift.
Tip or slide
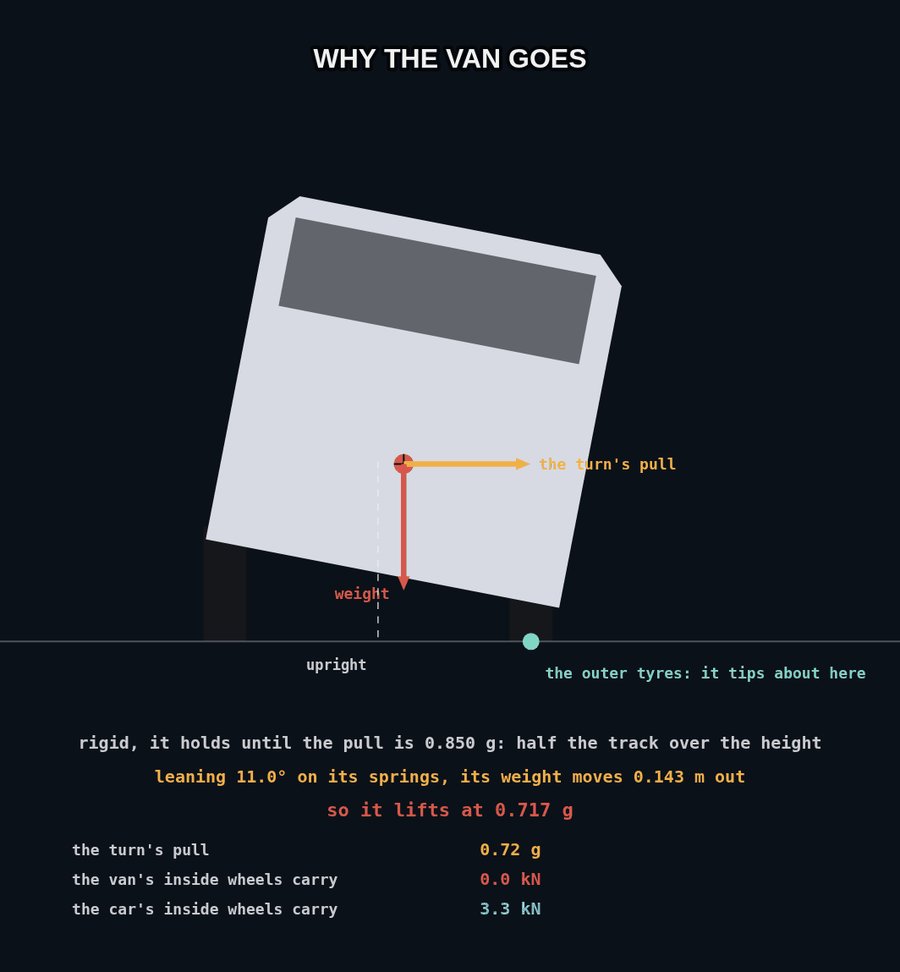
A turn pulls a vehicle's weight outward at its centre of gravity while the tyres pull back at the road, so the turn tries to roll it over its outer tyres. Take moments about them, and the inner wheels lift when the turn's pull reaches the track over twice the height, T / 2h. For a car with a 1.55 m track and its centre of gravity 0.55 m up, that is 1.41 g. For a van on a 1.7 m track, loaded so its centre of gravity sits 1.0 m up, it is 0.85 g.
On its springs the body also leans out and carries its weight with it. The car's inner wheels then lift at 1.31 g, leaning 7.76 degrees. The van's lift at 0.717 g, leaning 10.99 degrees with its weight 0.143 m further out. A dry road's tyres let go at 1.00 g. So the car slides first and the van tips first. Round a 50 m curve, the van's inner wheels lift at 67.5 km/h, where its tyres would have held to 79.7.
The leaning body's balance is solved by Newton's method inside a bisection on the inner wheels' load. The second route steps the body rolling on its springs and dampers through a turn that slowly tightens, and its inner wheels lift within 8.6e-5 g of the same point.
What is ours
- The roads, cars, van and dials are drawings. Every number on them is a readout from the engine.
- From memory and not checked: the grip curve's coefficients for each surface, and how far headlights light the road.
- Chosen: the 1,500 kg car and how fast its brakes come on, the 1.5 s reaction time, the curves and speeds, the drifting car and its circle, and the car's and van's sizes and springs.
- Left out: weight moving between the wheels as a car brakes or turns (except the van's lean), suspension in the braking runs, air, slopes, tyres heating up, and a real anti-lock system's control logic, which here simply holds the slip in a band round the grip's peak.
- Real stopping distances depend on the tyres, the road and the driver. These are one model's, worked through exactly.